Introduction
In the first half of 2026, the global shipping market experienced a complex situation intertwined with multiple factors. The continued escalation of the Red Sea crisis, lingering effects of the Panama Canal drought, diverging global trade growth rates, and deep adjustments in the geoeconomic landscape together shaped a freight rate environment filled with challenges and opportunities. Freight forwarding service providers and import-export enterprises have generally faced increasingly volatile freight rates, tight vessel space, and persistently high supply chain uncertainty. This article systematically reviews the first half of 2026's performance in the global international logistics market from four dimensions: freight rate trends, port dynamics, key market events, and outlook analysis.
1. Freight Rate Trends: High-Level Turbulence and Structural Divergence
1.1 Container Shipping Market Review
In the first half of 2026, global major container route freight rates showed a pattern of "high-level turbulence with structural divergence." Using the SCFI Composite Index as the observation indicator, from January to June 2026, the index fluctuated widely between 3,200 and 4,800 points, with the average rate approximately 18% higher than the same period in 2025. The drivers behind freight rate increases are diverse and complex: the route extension and capacity loss caused by the Red Sea crisis form the fundamental support, combined with concentrated release of restocking demand from Europe and the U.S. at the beginning of the year, together driving a phased surge in freight rates.
By route, the Asia-Europe route, most directly impacted by the Red Sea crisis, led global freight rate increases; transpacific routes, lagging behind due to Panama Canal capacity constraints, maintained relatively high freight rates of $3,000 to $3,800 per TEU for Asia-to-U.S. West Coast shipments; intra-Asian routes showed the manufacturing transfer effect in the Southeast Asian market continuing to manifest, with shipments from Vietnam and Thailand to Europe and the U.S. maintaining growth, supporting freight rates. Notably, South American and African routes showed significant divergence in the first half—South America-to-Asia agricultural shipment peak season supported firm freight rates, while African routes remained relatively weak due to destination market economic pressures.
1.2 Dry Bulk and Tanker Market Comparison
The high-volatility pattern in the container market contrasts with divergent trends in dry bulk and tanker markets. In the first half of 2026, the Baltic Dry Index (BDI) operated in the 1,200 to 1,800 range. Influenced by declining Chinese real estate completion area dragging down iron ore import demand, cape vessel freight rates were平淡. Iron ore freight from Brazil to China on cape vessels fluctuated between $15 and $20 per ton, significantly lower than the same periods in previous years. In the tanker market, crude oil vessel freight rates remained at low levels under combined pressure from continued OPEC+ production cuts and slowing global crude oil demand growth, while product tankers, due to refinery operating rate increases and diversified trade flows, performed relatively better than crude carriers.
1.3 Freight Rate Volatility Drivers
Behind high-level freight rate turbulence lies the cumulative effect of multiple medium-to-long term factors and short-term shocks. From the supply side analysis, global container fleet capacity growth is expected to reach 4.5% in 2026, with theoretically relatively ample supply; but the actual capacity loss caused by the Red Sea crisis is approximately 15% to 20%, with Cape of Good Hope detours extending vessel turnaround time by approximately 10 days, equivalently reducing market available cargo space. From the demand side observation, after nearly two years of inventory destocking in European and U.S. markets, a phased restocking demand appeared at the beginning of the year, combined with the pre-Spring Festival shipment peak, driving concentrated shipments in the spot market.
The difficulty of transportation cost optimization has significantly increased under this background. Shipping companies tend to tighten space release during periods of capacity tightness, exacerbating spot market space shortages. Shippers, to secure space, have to accept higher freight forwarding prices or book further in advance. Small and medium-sized import-export enterprises have endured significant cost pressures in this process, with some low-margin commodity traders even experiencing "freight rate inversion"—logistics costs eroding commodity trade profits.
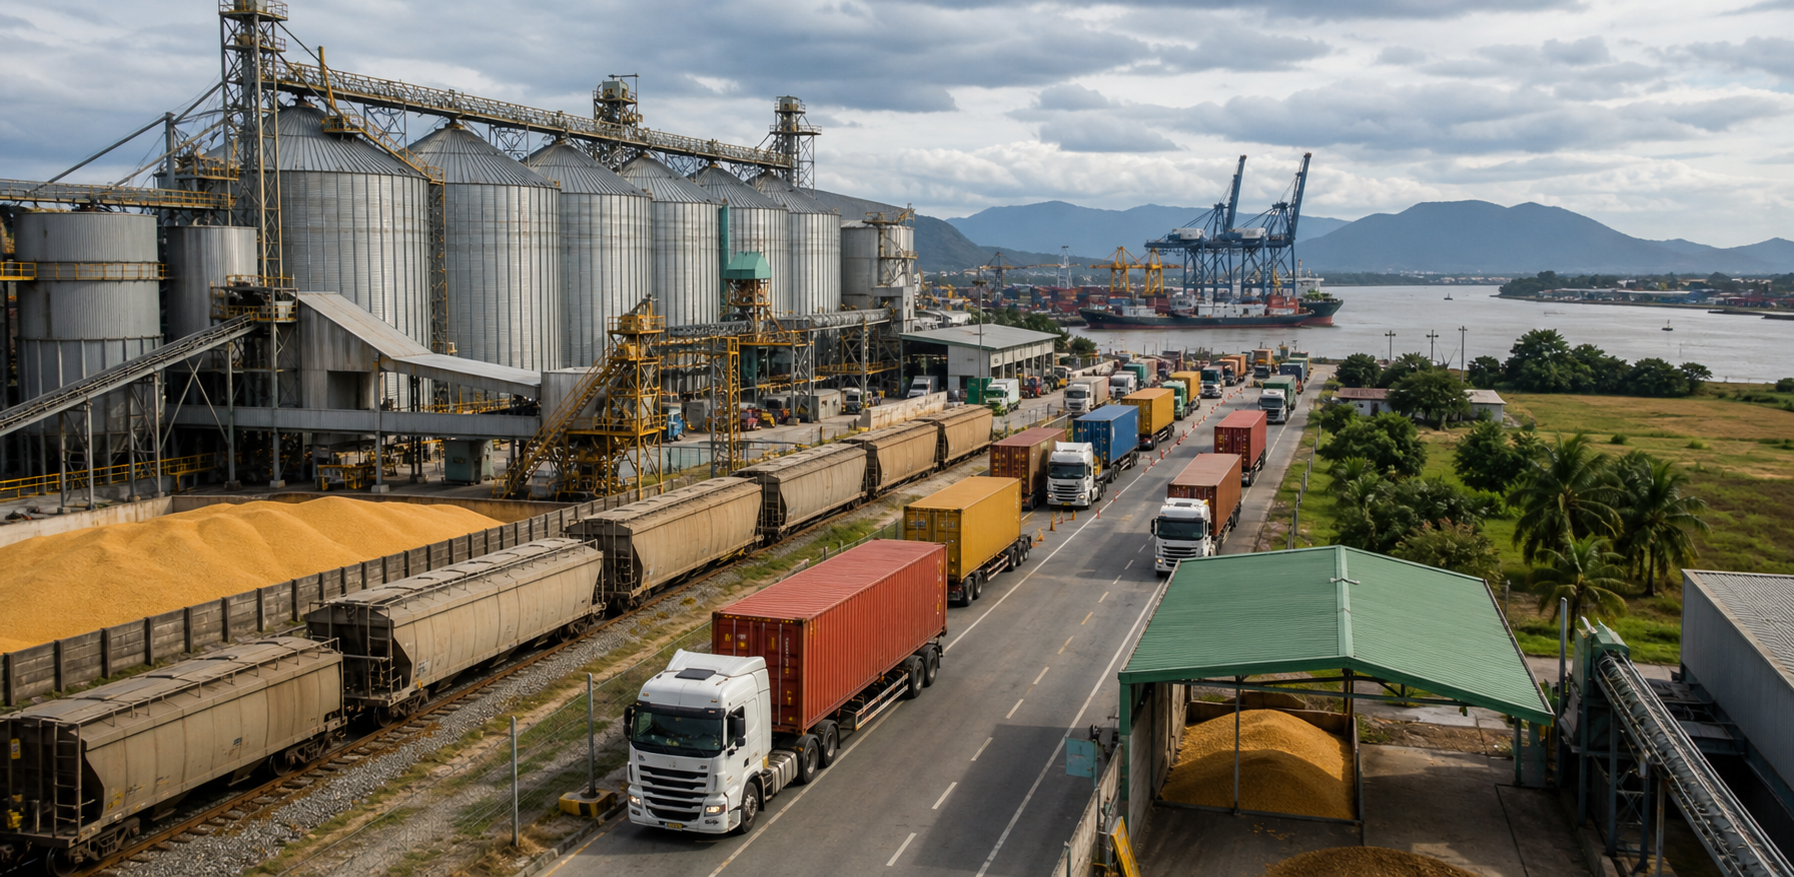
2. Port Dynamics: Congestion and Efficiency Rebalancing
2.1 European Ports: Throughput Pressure and Port Call Adjustments
In the first half of 2026, major European ports continued the busy trend since the second half of 2025. Container throughput at Hamburg Port, Rotterdam Port, and Antwerp Port grew 3% to 5% year-on-year, and seemingly modest growth understates the terminal operation pressure from vessel upsizing and route restructuring. Notably, because a large number of Asia-Europe route vessels arrive in Europe via Cape of Good Hope detours, the Eastern Mediterranean region's port hub status has significantly elevated—the role of Greece's Piraeus Port as an Eastern Mediterranean transshipment centre has further strengthened, with its container throughput achieving double-digit growth in the first half.
Another layer of port congestion is the凸显 of railway collection and distribution bottlenecks. European inland transport的高度依赖铁路网络, but railway capacity growth relatively lags behind port throughput expansion, causing container yard density at Hamburg and Rotterdam ports to rise to over 80% of design capacity during peak periods. At certain times, shippers needed to wait three to five days to complete cargo consolidation and loading/unloading, further extending supply chain terminal transit times.
2.2 Asian Ports: Rise of Southeast Asian Emerging Hubs
The Asian port landscape in 2026 presents a divergence of "traditional hubs remaining robust, emerging hubs rising." China's port groups, with complete industrial chain support and efficient operations, continue to lead global container throughput. Shanghai Port, Ningbo-Zhoushan Port, and Shenzhen Port maintained steady growth in the first half, but growth rates have transitioned from high-speed to high-quality development periods. Meanwhile, throughput growth rates at Vietnam's Hai Phong Port, Thailand's Laem Chabang Port, and Malaysia's Port Klang have significantly exceeded industry averages, reflecting the structural trend of manufacturing industry gradient transfer to Southeast Asia.
2.3 North American Ports: Panama Canal Drought Aftermath Continues
The impact of the Panama Canal drought on North American ports continued to ferment in the first half of 2026. Canal transit restrictions caused some transpacific route vessels to choose detours via the Strait of Magellan or via Suez Canal, with route network restructuring causing structural decline in cargo concentration at U.S. West Coast ports. Container throughput at Los Angeles Port and Long Beach Port showed negative year-on-year growth, while U.S. East Coast ports, sharing part of the Asia-to-U.S. cargo flow, maintained relatively steady throughput. Industry insiders point out that the canal's normalized restrictions may drive more trans-ocean cargo to choose all-water routes or rail-sea intermodal solutions, with far-reaching implications for the global logistics network layout.
3. Key Events and Industry Focus
3.1 Red Sea Crisis and Shipping Alliance Adjustments
In the first half of 2026, the Red Sea crisis continued to dominate the global shipping market. The four major shipping alliances (2M, Ocean Alliance, THE Alliance, and Premier Alliance) continuously adjusted route configurations, with the proportion of Cape of Good Hope detours remaining above 70%. This situation prompted some shipping companies to accelerate space sharing agreement negotiations with competitors to maintain service network coverage in a tight capacity environment. Hapag-Lloyd and Maersk's space exchange cooperation further expanded in the first half, while COSCO Shipping and Evergreen's alliance cooperation also intensified due to market needs.
3.2 Environmental Regulations and Vessel Speed Control
2026 is a key implementation node for the IMO's greenhouse gas emission reduction strategy. Strict enforcement of regulations such as EEXI (Existing Ship Energy Efficiency Index) and CII (Carbon Intensity Indicator) has forced older vessels to accelerate market exit or reduce operational speeds. Data shows that the global container fleet's average speed in the first half of 2026 decreased by approximately 0.5 knots compared to 2024, dropping to approximately 13.5 knots. While speed reduction reduced fuel consumption and carbon emissions, it objectively also extended vessel turnaround times, further tightening effective supply in an already capacity-constrained environment. Freight forwarding service providers need to factor vessel speed control into transport time calculations.
3.3 Digitalization and Blockchain Application Deepening
The environment of freight rate volatility and high supply chain uncertainty has conversely accelerated the digitalization process of the international logistics industry. Several leading freight forwarding companies announced deepening blockchain technology applications in cross-border trade documentation, achieving electronic processing of bills of lading, sea waybills, and insurance documents, significantly reducing time and compliance risks of paper document delivery. Adoption rates of vessel tracking systems, intelligent customs clearance platforms, and automated warehouse management systems continued to rise in the first half of 2026, with digital capabilities becoming an important dimension of core competitiveness for freight forwarding companies.
4. Market Outlook and Influencing Factors Analysis
4.1 Key Factors Influencing Freight Rate Trends
Looking ahead to the second half of 2026 through 2027, global shipping freight rate trends will be shaped by the combined effects of the following key factors: First, the Red Sea crisis evolution—if the situation remains tense or further deteriorates, Cape of Good Hope detours will become a long-term option, and the Asia-Europe route freight rate risk premium will normalize; second, marginal changes in global trade growth—after the European and U.S. restocking cycle ends, substantive improvement in end-demand will determine freight rate support strength; third, newbuilding delivery pace—the second half of 2026 through 2027 will see a wave of concentrated container vessel deliveries, with theoretical supply pressure gradually emerging after 2027.
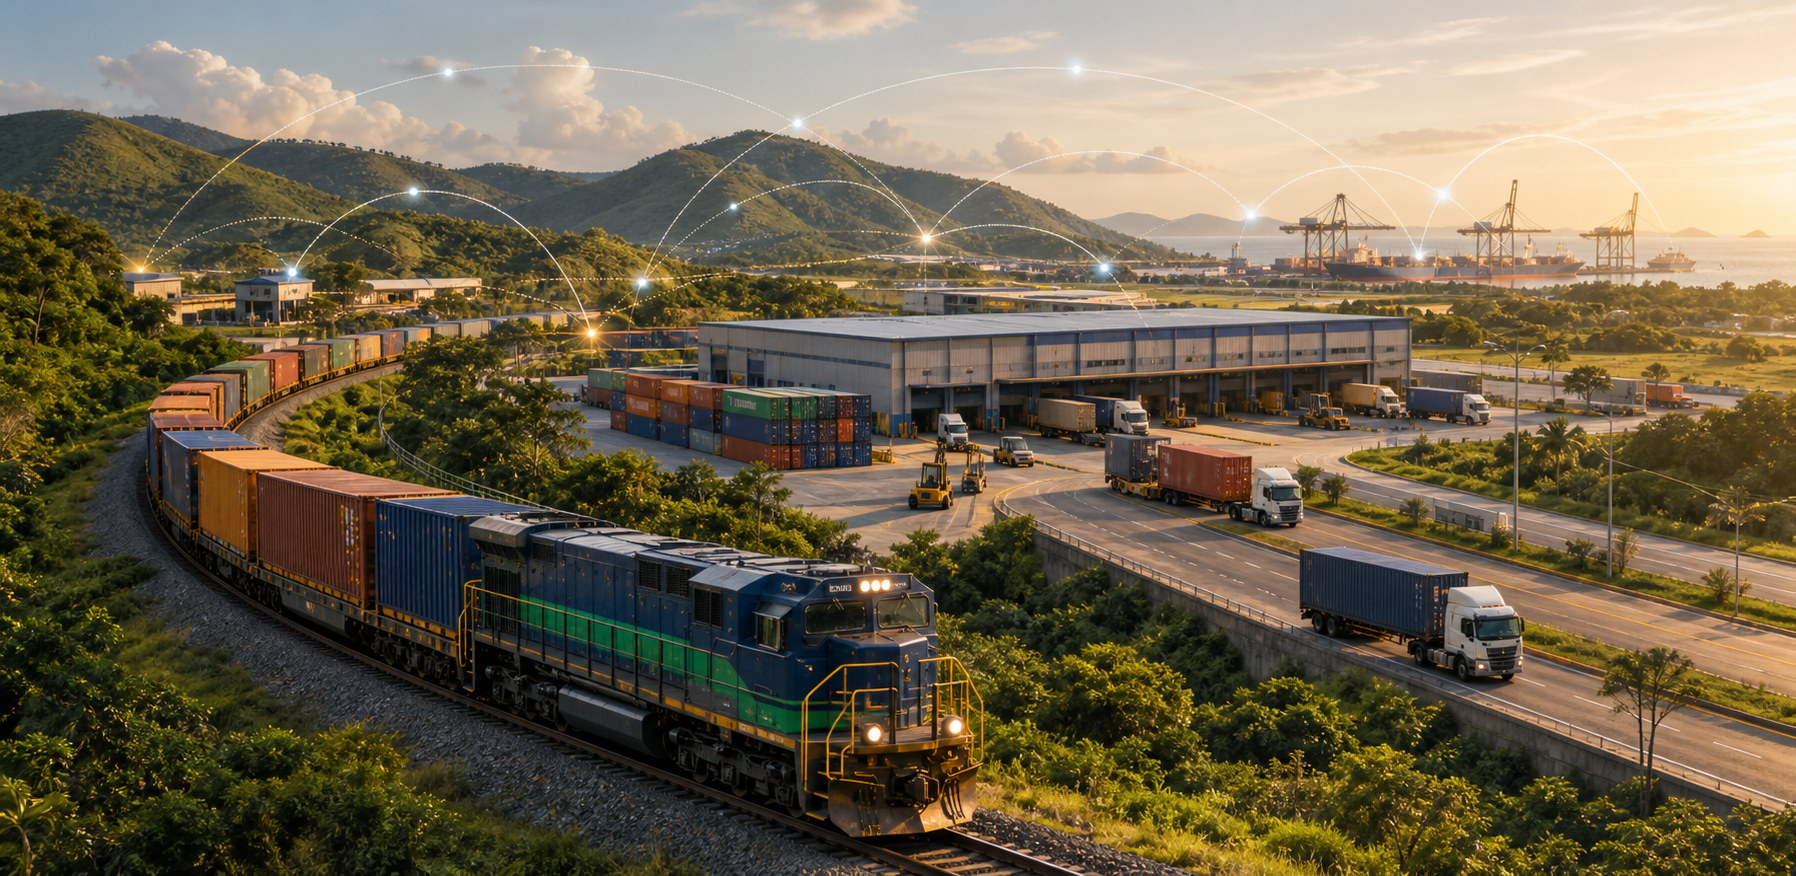
4.2 Port and Intermodal Trends
On the port side, construction of Southeast Asian emerging hubs will continue to accelerate. Governments of Vietnam, Indonesia, and Malaysia have all identified port infrastructure as a key investment direction, with multiple medium-sized container terminals expected to become operational within the next three to five years. In intermodal services, the stable operation of China-Europe Express trains provides an important alternative channel for Asia-Europe logistics, with the cargo type and value levels of cross-border rail transport expected to further improve. Freight forwarding service providers need to monitor intermodal channel capacity expansion and cost changes, offering clients more diversified logistics solutions.
Trends and Outlook
The global shipping market in the first half of 2026 can be summarized with eight characters: "high-level turbulence, divergence continues." The Red Sea crisis has reshaped the Asia-Europe route landscape, freight forwarding price volatility centers have shifted upward, and transportation cost optimization has become more difficult; port congestion and efficiency improvement seek rebalancing amid structural adjustments; digitalization and green shipping have become the main lines of industry transformation. Looking ahead, freight rates face downward pressure in the second half, but the decline may be limited—Red Sea crisis uncertainty and newbuilding delivery timing will together determine the market's medium-to-long term direction.
For international logistics industry participants, 2026 is destined to be a year full of challenges and transformation. Freight forwarding companies need to continuously strengthen professional capabilities in freight rate analysis, route optimization, and supply chain coordination to help clients navigate market fluctuations with a cycle-crossing strategic perspective. Only by building competitive barriers through digital capabilities and value-added services can companies establish solid footing and win the future during the industry's deep adjustment period. The deep-seated transformation of the global trade landscape is arriving, and logistics service providers will be important witnesses and participants in this transformation.


China——Brazil Trajectory Tracking


+86 532-85066033/34