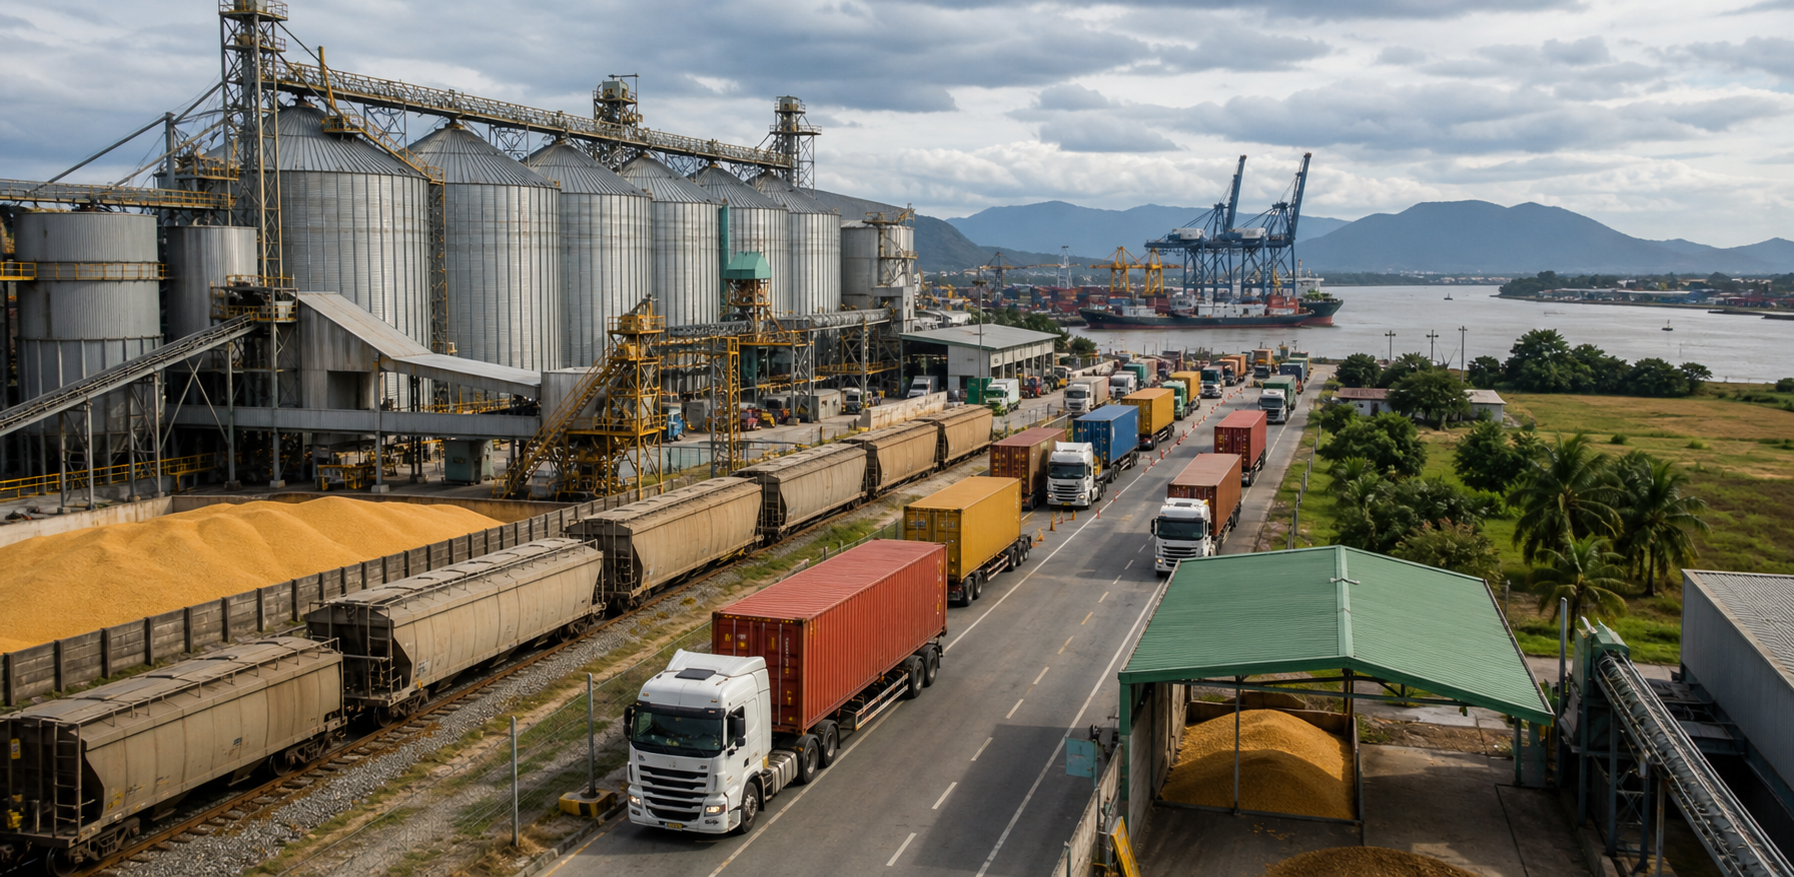
In the first half of 2025, global container ports experienced a bumper season. According to statistics from Container Trade Statistics (CTS), global container traffic reached 93.5 million TEUs in the first half, representing a 4.5% year-on-year increase. Nearly all major regions saw growth in import and export container volumes, leading to a total throughput increase of 9.91 million TEUs at the top 30 container ports globally, a 4.4% year-on-year growth. Among these ports, only the throughputs at the ports of Hong Kong and Kaohsiung declined.
Among the top 30 container ports globally, Chinese ports occupy 11 positions, with mainland Chinese ports witnessing record throughputs at multiple ports, unaffected by the trade war. Chinese ports have increased trade with Europe, Southeast Asia, Africa, and Latin America. CTS data shows that in the first half of the year, container traffic from China to North America saw a slight increase of 0.8%, while container traffic to Europe surged by 9.7%.
Southeast Asian and South Asian ports hold 10 positions among the top 30 globally. While most rank between 11 and 30, their throughput growth has been rapid in recent years, indicating an increasing importance in the global container shipping market during the supply chain shift.
The top ten ports are predominantly long-standing, including Shanghai Port (1), Singapore Port (2), Ningbo-Zhoushan Port (3), Shenzhen Port (4), Qingdao Port (5), Guangzhou Port (6), Busan Port (7), Tianjin Port (8), Jebel Ali Port (9), and Port Klang (10). After Rotterdam Port and Hong Kong Port fell out of the top ten, the rankings of the top ten have stabilized.
The growth rates of the top five ports are more robust than those of ports ranked 6 to 10, with increments exceeding 1 million TEUs, with Guangzhou Port seeing an increase of 980,000 TEUs. The top six global container ports have seen the largest increments, highlighting the increasing clustering effect of major ports in global container transport.
Ningbo-Zhoushan Port saw the largest increase in throughput among all listed ports, with a year-on-year growth of 1.89 million TEUs. Surprisingly, its international competitor, Singapore Port, also experienced a 7.2% year-on-year growth. Following the decision of the 2M Alliance to designate Tanjung Pelepas Port as a transshipment hub, Singapore Port strengthened its cooperation with other shipping alliances and companies.
The throughput and rankings of Hong Kong Port continued to decline, while Kaohsiung Port faced a similar fate, dropping out of the top 20. As these two major ports became transshipment hubs, the transshipment volumes have been declining due to the rise of mainland Chinese and Southeast Asian ports, making recovery challenging in the future.
The three major U.S. ports—Los Angeles, Long Beach, and New York-New Jersey—seem to be unfazed by the trade war. In the first half of the year, container traffic from Asia to North America grew by 8.2% year-on-year, primarily due to retailers stocking up and companies rushing shipments amid uncertain tariff policies, leading to an unusually strong season. However, in the second half of the year, U.S. ports may face a downturn. According to the National Retail Federation (NRF) forecast, total U.S. imports are expected to decrease by 5.6% this year, with container imports in the last five months projected to drop by 17.5%.


China——Brazil Trajectory Tracking


+86 532-85066033/34