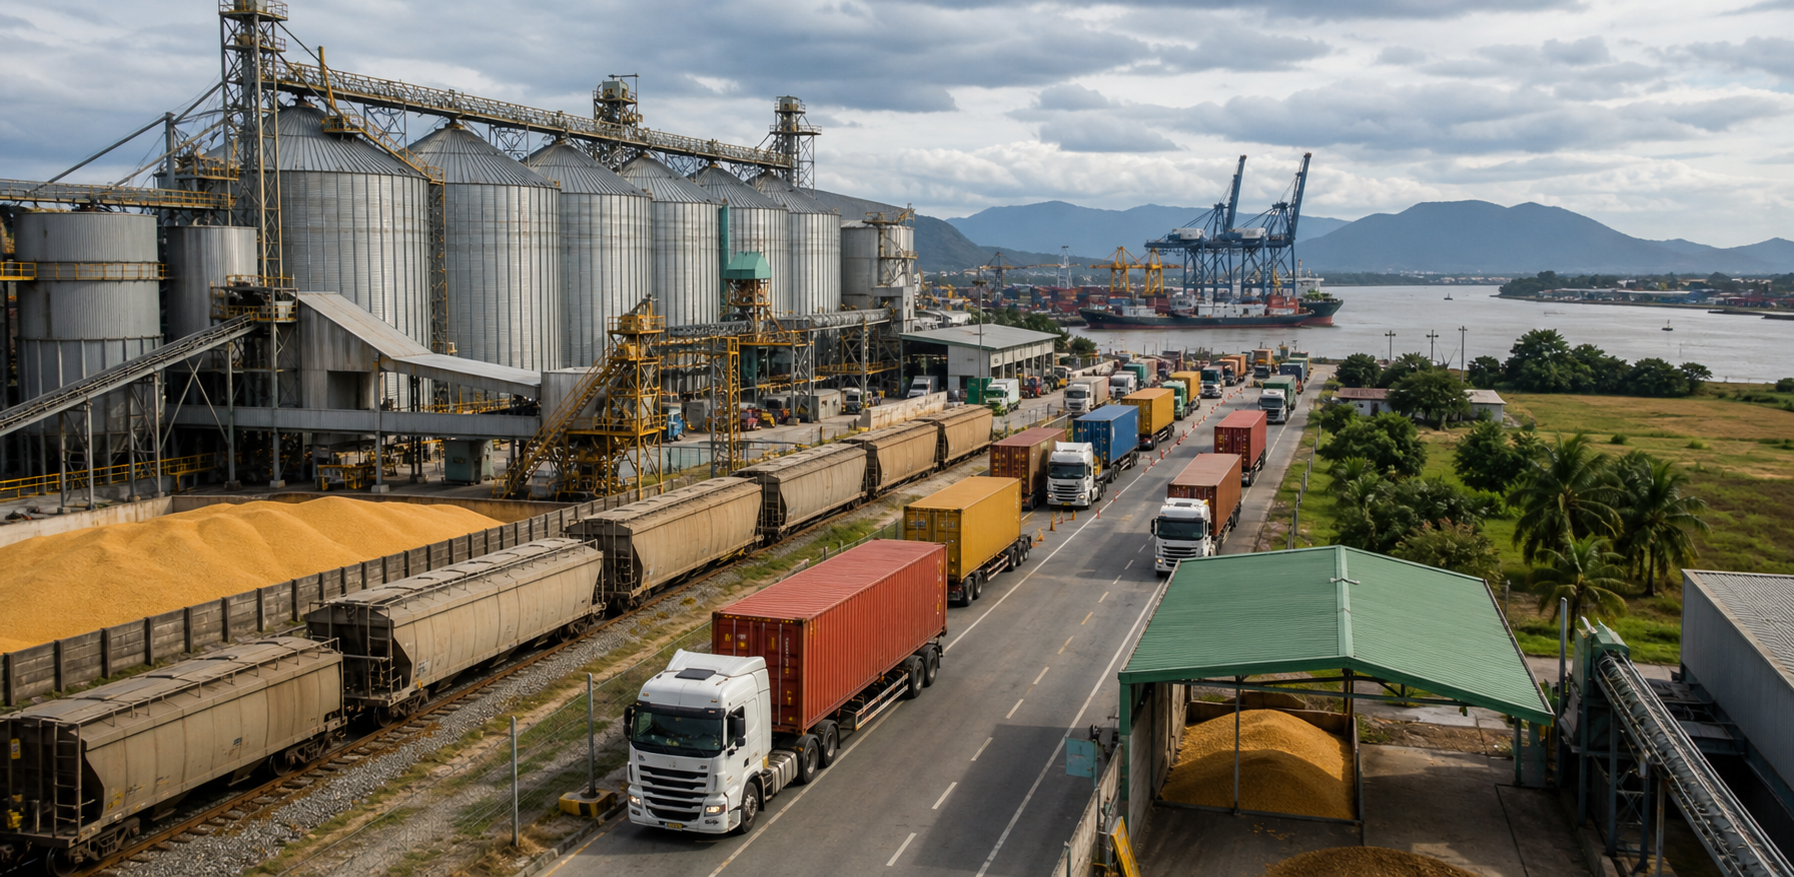
Introduction
In the first half of 2026, the global container shipping market exhibited significant divergent dynamics. While the Asia-Europe lane, suppressed by the Red Sea crisis and weak demand, saw freight rates oscillate at low levels, the trans-Pacific lanes—particularly the U.S. West Coast—bucked broader market trends to post strong independent performance. The Shanghai Containerized Freight Index (SCFI) shows that as of late May 2026, the U.S. West Coast freight index reported $2,820/FEU, rebounding more than 35% from early-year lows, with cumulative annual gains exceeding 20%. This "U.S. lane independent strength" pattern contrasts sharply with the broadly pessimistic expectations held by industry participants at the start of the year, sparking widespread attention and deep reflection among market players. This article systematically analyzes the drivers behind trans-Pacific freight rate strength, market structural characteristics, and subsequent evolution judgments, providing decision-making reference for freight forwarding and international logistics practitioners.
Drivers Behind Trans-Pacific Freight Rates Defying Market Weakness
1.1 Unexpected Resilience of U.S. Consumer Demand
Since 2026, the U.S. consumer market has not experienced the significant cooling that institutions predicted at the start of the year. Bureau of Labor Statistics data shows U.S. retail sales grew 0.8% quarter-over-quarter and 3.2% year-over-year in Q1, with consumer spending resilience exceeding expectations. The "回流效应"—the shift from services consumption back to goods consumption—continues to manifest. While dining, travel, and other offline service sector spending remains active, the continued rise in e-commerce penetration rates and consumers'刚性 demand for physical goods have jointly supported steady growth in container import volumes.
More critically, the inventory replenishment cycle for U.S. retailers and manufacturers has not yet concluded. In the second half of 2025, affected by the Red Sea crisis and port congestion, U.S. importers adopted cautious inventory-building strategies ahead of the Thanksgiving and Christmas sales seasons, leaving channel inventories at relatively low levels. From Q1 2026, importers entered a new inventory replenishment cycle, with concentrated demand release providing strong support for trans-Pacific lane slot demand. The National Retail Federation's latest forecast revised 2026 first-half U.S. container import volume growth upward to 4.8%—nearly two percentage points higher than initial estimates.
1.2 Shipping Lines' Proactive Capacity Management
Another key factor behind trans-Pacific freight rate strength is shipping lines' proactive capacity management. Since 2026, major carriers including Maersk, CMA CGM, and Hapag-Lloyd have continuously implemented "blank sailing" strategies on trans-Pacific routes. According to Drewry statistics, approximately 28 voyages were cancelled on Asia-to-North America routes in Q1 2026, equivalent to approximately 9% of normal capacity. Through proactive supply reduction, shipping lines have effectively checked rapid off-season freight rate declines and maintained lane rates in profitable ranges ahead of peak season.
This strategy reflects profound changes in liner market structure. Following intense consolidation and M&A activity since 2020, the market share of the global top ten container shipping lines has exceeded 85%, with significantly increased market concentration. Leading carriers' coordination awareness on pricing strategies has notably strengthened, and "supply-side management" has become the industry's new normal. Compared to the Asia-Europe lane, where more participants and higher coordination difficulty prevail, trans-Pacific capacity management implementation is more efficient and its effects more pronounced.
1.3 Red Sea Crisis Indirect Transmission to U.S. Lanes
The Red Sea crisis has produced complex indirect effects on trans-Pacific shipping lane rate trends. On one hand, the voyage extension from rerouting around the Cape of Good Hope consumed substantial effective capacity, forcing shipping lines to deploy vessels from other lanes to fill U.S. lane gaps—thereby partially improving the trans-Pacific lane's supply tightness. On the other hand, the Suez Canal congestion caused by the Red Sea crisis has imposed greater limitations on routes to the U.S. East Coast—some cargo originally capable of transiting through Suez directly to the U.S. East from South Asia and the Middle East has been forced to reroute via the Cape of Good Hope or Panama Canal, further elevating U.S. East Coast lane rates.
Notably, the international trade uncertainty intensified by the Red Sea crisis has prompted some importers to adjust procurement strategies, accelerating the shift from China to alternative supply locations in Southeast Asia and Mexico. Rapid growth in exports from Vietnam and Mexico to the United States has marginally increased the trans-Pacific lane cargo volume base, providing positive support for freight rates.
Market Divergence Characteristics: U.S. West Coast vs. East Coast Lanes
2.1 U.S. West Coast: Rates Lead the Rise, Slots Tight
In the first half of 2026, the U.S. West Coast lane (Pacific Southwest, PSW) emerged as the leader of the trans-Pacific market. Despite the Port of Los Angeles and Long Beach having undergone large-scale expansion and automation upgrades in 2025, improving terminal yard utilization, fundamental port congestion issues have not been resolved. According to Pacific Merchant Shipping Association data, the average waiting time at the Port of Los Angeles in May 2026 was approximately 1.5 days—higher than the 0.8 days during the same period last year.
Tight capacity combined with demand recovery has intensified slot competition on westbound U.S. lanes. According to freight forwarding industry feedback, trans-Pacific West Coast lane slot utilization rates in May 2026 generally reached above 95%, with some sailings experiencing overbooking situations. Shipping lines' priority guarantee strategies for U.S. West Coast lanes have caused some low-priced cargo to be deferred to subsequent voyages, with rollover rates rising. Freight forwarding price increases on U.S. West Coast lanes have significantly outpaced those on U.S. East Coast lanes—the SCFI West Coast index cumulative annual gain exceeded 30%, notably outpacing the U.S. East Coast lane's approximately 15% gain.
2.2 U.S. East Coast: Rates Follow with Structural Differentiation
The U.S. East Coast lane (Pacific Southeast, PSE) presents a differentiated structure from the West Coast. Constrained by limited Panama Canal transit capacity and weaker U.S. East Coast port group infrastructure for cargo collection and distribution, U.S. East Coast lane rate increases have lagged relatively. Major U.S. East Coast ports such as Houston and Savannah have maintained consistently high terminal yard utilization, with some refrigerated container slots experiencing shortages.
From a cargo type structural perspective, high value-added goods constitute a relatively higher proportion on U.S. East Coast lanes, including machinery, electronic products, and chemicals. These goods have lower sensitivity to freight rate changes, with cargo owners demonstrating stronger acceptance capacity for freight rate increases. Low value-added daily consumer goods and textile cargo owners, however, face greater cost pressures, with some orders already beginning to divert toward U.S. West Coast ports.
2.3 Trans-Pacific vs. Asia-Europe Lane: A Horizontal Comparison
Comparing trans-Pacific lanes with Asia-Europe lanes more clearly illustrates the market's divergence pattern. In May 2026, the SCFI Asia-Europe lane freight rate index was approximately $3,200/TEU—higher than U.S. West Coast rates—but its cumulative annual gain was only approximately 18%, notably lower than the U.S. West Coast's above-30% gain. More importantly, Asia-Europe lane spot freight rates remain near some shipping lines' cost breakeven levels, with the alarm for industry-wide loss-making operations yet to be lifted. U.S. West Coast lane rate levels have already enabled most liner companies to restore profitability, and the widening profit gap will further reinforce shipping lines' preferential allocation of capacity toward U.S. lanes.
Market Challenges and Responses for Freight Forwarding Services
3.1 Increased Difficulty in Slot Acquisition
The coexistence of stronger trans-Pacific freight rates and tight slot availability poses elevated requirements on freight forwarders' slot acquisition capabilities. In a seller's market, shipping lines prioritize slot allocation for large clients and long-term contract customers. Spot market customers and small-to-medium clients face more severe slot compression. Freight forwarding service enterprises lacking stable shipping line partnerships will struggle to guarantee reliable slots for clients during peak seasons, and their core competitive service capabilities will be questioned.
Drewry's latest research shows that the freight forwarding industry's average trans-Pacific slot guarantee rate in Q1 2026 was approximately 78%—down from 85% in the same period last year. Freight forwarders are responding to this challenge by deepening strategic partnerships with major shipping lines and locking slots and rates in advance. However, correspondingly, the capital occupation and pricing risk associated with locked slots are also increasing.
3.2 Intensified Freight Forwarding Price Volatility
In an environment of strengthening freight rates, freight forwarding price volatility has significantly intensified. As freight forwarders pay upstream to shipping lines for capacity, they face margin risk between downstream client quotes and actual execution prices. When freight rates rise rapidly in the short term, forwarders who fail to update quotes to clients in a timely manner may absorb cost increases while their revenue remains unchanged, compressing profits. Conversely, when freight rates decline, previously locked high-priced slots may lose market competitiveness.
Professional international logistics service providers recommend that freight forwarders establish more flexible freight rate risk management mechanisms, including: establishing freight linkage clauses with clients to share bunker adjustment fees and freight rate volatility risk; utilizing derivative instruments (such as freight index derivatives) to hedge partial freight rate risk; and strengthening market intelligence and forecasting capabilities to enhance forward-looking response capabilities for freight rate volatility.
3.3 Customer Demand Segmentation and Service Upgrade
The trans-Pacific market's divergence pattern is propelling freight forwarding services toward demand segmentation and productization. For large Beneficial Cargo Owners (BCOs), freight forwarders provide long-term rate lock contracts and exclusive slot guarantee services, with pricing models emphasizing service fees and value-added service premiums. For small-to-medium clients and cross-border e-commerce clients, freight forwarders focus on route product standardization and operational efficiency optimization, competing through low-price, high-volume models.
Transportation cost optimization capability value becomes increasingly prominent in this environment. Freight forwarders with professional capabilities can help clients reduce per-box transportation costs through optimized loading plans, LCL cargo consolidation, and rational collection schedule planning—thereby creating genuine value for clients in an environment of rising freight rates while capturing corresponding service premiums.
Trends and Outlook
Looking ahead to the second half of 2026, whether the trans-Pacific lane's high prosperity can sustain depends on the evolution paths of multiple factors. On the demand side, U.S. consumer resilience faces uncertainty amid the Federal Reserve maintaining elevated interest rate policies, with household consumption spending growth potentially gradually moderating. On the supply side, shipping lines' capacity delivery schedules and blank sailing strategy adjustments will serve as the key variables guiding market direction.
Drewry maintains a cautiously optimistic judgment on the 2026 trans-Pacific lane freight rate中枢, estimating average annual U.S. West Coast lane rates at approximately $2,600–$2,900/FEU and U.S. East Coast lane rates at approximately $3,600–$3,900/FEU—improved compared to 2025 but with limited room for substantial further upside. Freight forwarding service enterprises should, in this market environment, leverage the freight rate rebound window period to strengthen client relationship development and supply chain service capability upgrades, while preparing for potential market corrections following peak season conclusion.
This round of independent trans-Pacific lane performance once again confirms the high dynamism and complexity of the international logistics market. Under the dual trends of globalization restructuring and supply chain resilience building, freight forwarding enterprises can only achieve sustainable competitive advantage in an increasingly divergent and fiercely competitive market landscape by continuously enhancing professional service capabilities and digital operational levels.


China——Brazil Trajectory Tracking


+86 532-85066033/34